Viewing Key Statistics in Solve’s Connectivity Platform
Nov 10 , 2025
If you’ve deployed dozens—or thousands—of SIMs, one of your biggest challenges is visibility. You need to know which devices are active, how much data they’re using, whether anything looks abnormal, and which endpoints to troubleshoot first.
Solve’s Connectivity Platform gives you that visibility. In this blog, we’ll walk through the most useful reporting metrics, how to interpret them, and how they help you manage cost, performance, and reliability across your IoT fleet.
What Reporting Insights Should You Be Watching
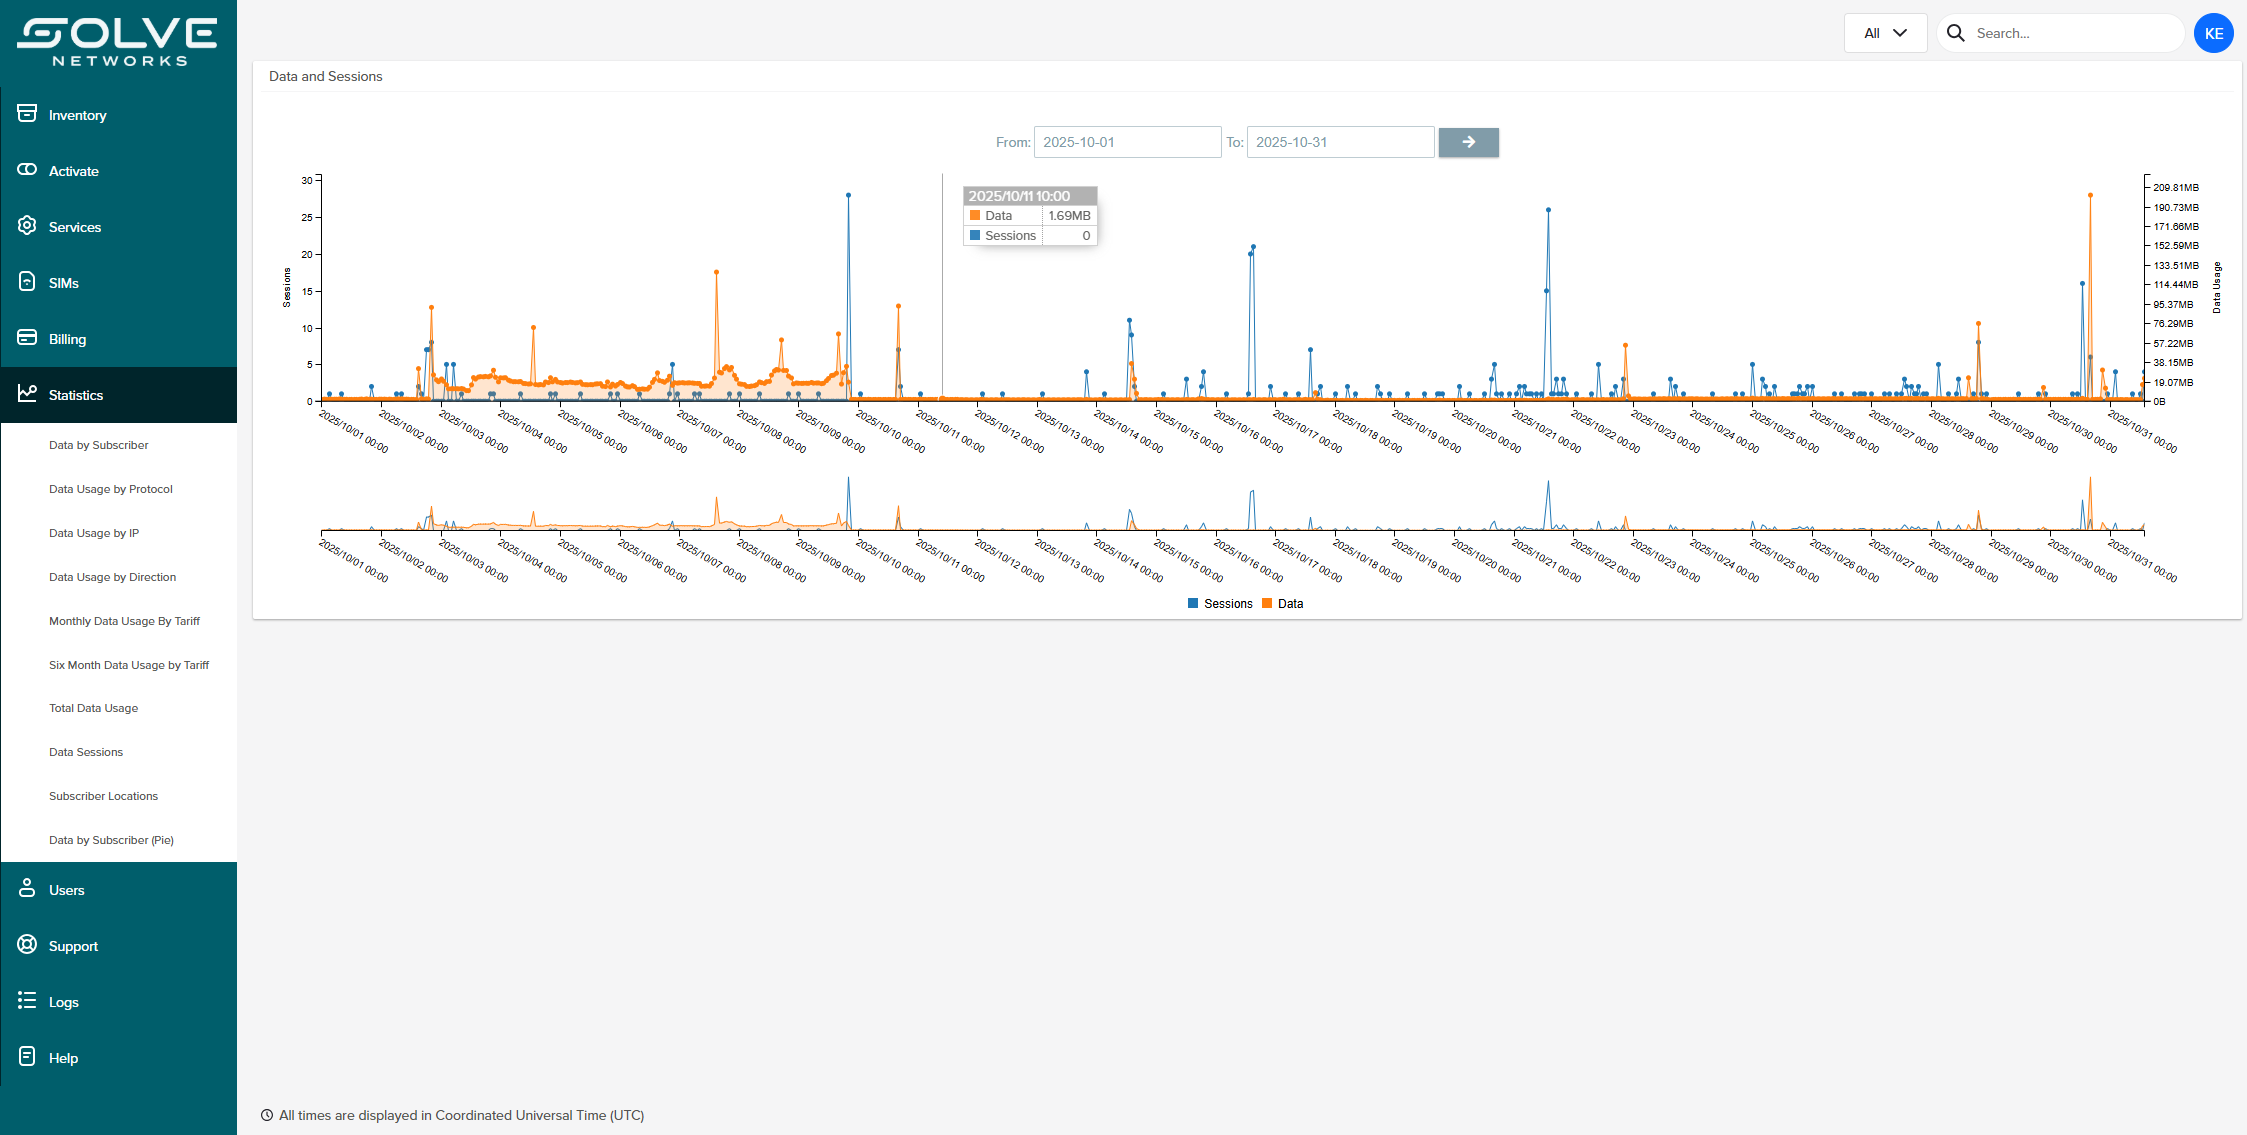
When you log into Solve’s platform and go to the Statistics tab, here are the key elements worth paying attention to:
Data by Subscriber
Track session counts for your fleet across any date range. This tells you where your bandwidth is going and helps predict future needs. Identify the devices eating the most data—helpful when investigating outliers or anomalies, or spotting misconfigured deployments.
Usage by Protocol or IP
See which protocols (e.g., MQTT, HTTPS, FTP) or destination IPs are consuming the most bandwidth. This helps you pinpoint inefficient traffic or misrouted data.
Data Usage by Direction
Knowing how much data is being sent vs. received may show imbalances or unexpected traffic spikes.
Monthly Data Usage by Tariff
Compare how your actual usage maps to plan limits. That’s where right-sizing and avoiding overages can save real money.
Total Data Usage
A high-level view for leadership and oversight—shows whether your fleet is scaling, idling, or spiking.
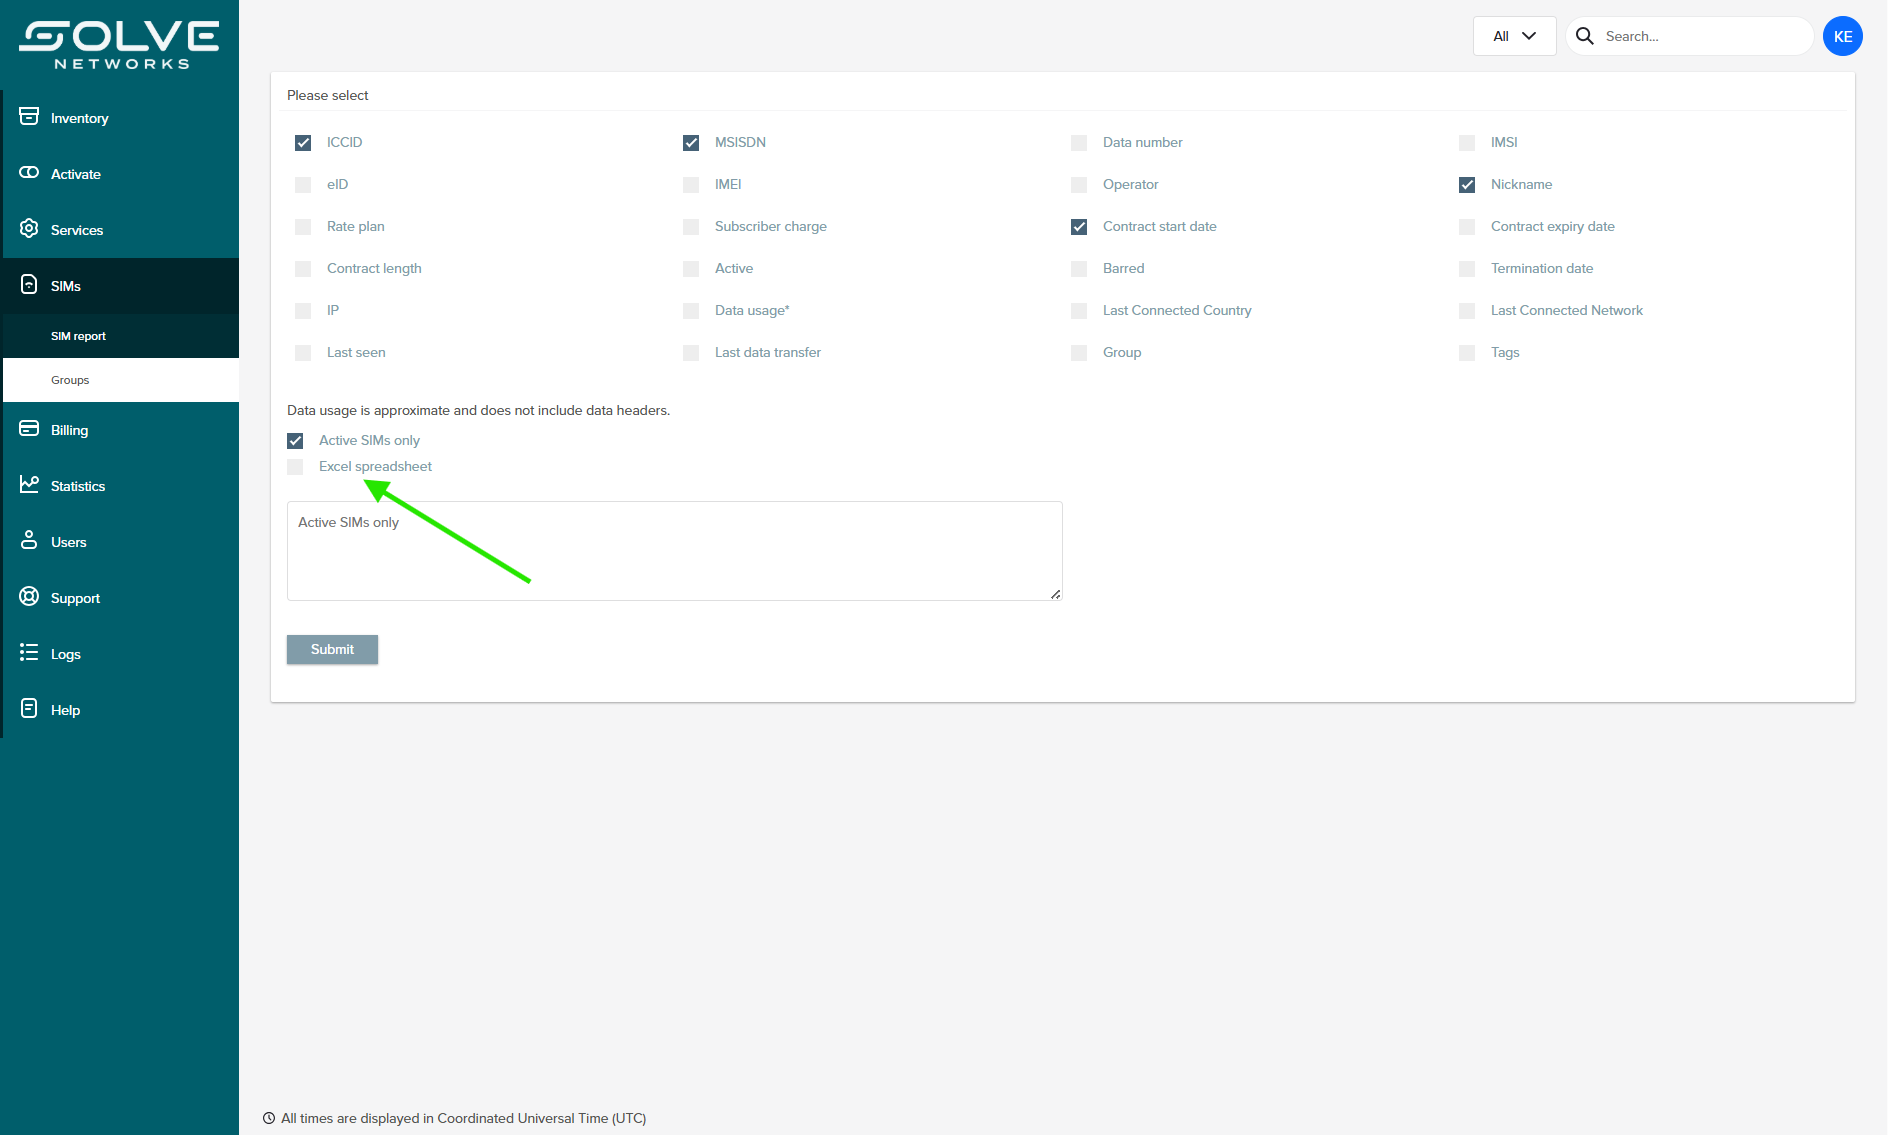
Additionally, underneath the SIMs tab, look out for the SIM Report. You can export all this data to an excel file and do all sorting, filtering, and analysis directly in Excel. See the image below for an example.
Why These Metrics Matter to You
These aren’t just numbers. They tell a story about your fleet’s health, performance, and cost profile. Here’s how you can use them:
- Prevent surprises in billing: Seeing usage outliers early helps you catch misconfigured devices before they blow through your data allowance.
- Preempt hardware failure: Devices that repeatedly reconnect or show high session counts just before failure? That’s a red flag worth investigating.
- Plan upgrades intelligently: Use data trends to decide when to scale, add redundancy, or move some devices into a different SIM category (single-carrier vs. multi-network).
- Fine-tune connectivity strategies: If many devices show slow throughput to a particular IP, you might reassign routing, adjust APNs, or prioritize traffic differently.
- Offer accountability and proof: When you need to report on SLAs, uptime, or data costs, these metrics become all the more relevant.
How Solve Builds Secure, Useful Reports
Solve’s platform doesn’t just surface data—it makes data actionable. Every reporting tool is built with usability and security in mind. Enterprise customers get filtering and alerting options that draw attention to outliers without overwhelming teams with noise. Exportable reports and APIs make it easy to pull this intelligence into existing systems, and access controls ensure the right people have the right visibility at the right time.
Most importantly, Solve gives customers a single view across AT&T, Verizon, and multi-network SIMs. Instead of juggling multiple carrier portals with inconsistent reporting formats, you can see your entire fleet in one place—streamlined, consistent, and secure.
Getting Started
Viewing statistics in the Solve Connectivity Platform is simple, but the implications are powerful. With a few clicks, you can see exactly how your devices are performing, spot potential problems before they escalate, and ensure your IoT deployment remains both cost-effective and reliable.